Local wind forecast
Loading the NWS hourly wind forecast…
Start with the shore forecast, then look closer at your beach.
Search a break or tap its marker. Select a spot for a report on the marker and beside the map: original wave-face heights, clearly labeled Hawaiian estimates, nearby wind and offshore buoy data where available. Canoes includes the latest NWS spot observation with its observation time; past reports are labeled.
Loading named surf breaks…
Choose a break to see its forecast context and original spot report.
Markers are approximate report locations, not lineup boundaries, entry routes or live surf-height readings. Zoom in to see labels around closely spaced breaks. Shore and buoy numbers remain regional; they are not measurements at your selected break.
Showing your selected island.
Pan and zoom around your island. Use the map’s timeline to compare forecast hours, and tap the water for wave height, period and direction.
Live-loaded forecast visualization by Windy, not a live camera or an observation. Read the model, units, legend and selected forecast time inside the map. The wave layer combines wind waves and swell; it does not predict the breaking height at a specific reef. Changing islands or layers resets the map view and timeline.
Open a larger map on WindyWind is a forecast for the named coastal town. Wave measurements come from the selected offshore buoy; they describe different locations.
Loading the NWS hourly wind forecast…
Checking PacIOOS / CDIP observations…
Significant wave height: the spectral estimate of the average height of the highest third of offshore waves, shown in feet and meters. Individual waves can be larger. It is different from the NWS breaking-wave face forecast above.
Peak period: the seconds between waves at the most energetic frequency. Average period describes the broader wave record. Direction is where the peak waves come from, in degrees true.
Wave energy density: a calculated estimate of energy per square meter of ocean surface, using E = ρgHs²/16, with seawater density 1,025 kg/m³ and gravity 9.81 m/s². The result is shown in kJ/m². Doubling height gives four times this energy density. This is not Surfline’s proprietary energy rating, wave power (kW/m), or energy per individual wave. Period is shown separately; it is not substituted for an energy period.
Only quality-controlled “good” buoy records from the last three hours are displayed. These are preliminary observations, not a beach safety rating. No suitable reading means “unavailable,” not zero waves.
PacIOOS / CDIP data and quality flagsWave-energy method and definitionsReadings refresh on opening, every 10 minutes while visible, and with Refresh surf report. The buoy sample time, forecast valid time and retrieval time are shown separately. Data: PacIOOS / CDIP and NOAA National Weather Service. Check the original buoy network.
Open the provider’s public camera page to watch. These pages do not require a paid subscription; streams may pause, show ads or go offline. Check the camera timestamp and daylight conditions.
Beach and ocean camera. Public Marriott / Ozolio camera page.
Watch free webcamBeach and ocean camera. Public Marriott / Ozolio camera page.
Watch free webcamBeach and ocean camera. Public Marriott / Ozolio camera page.
Watch free webcamBeach and ocean camera. Public Marriott / Ozolio camera page.
Watch free webcamFAA weather images. Select Molokai (PHMK) in the Hawaiʻi camera list. Periodically updated airport images, not a beach or surf feed.
Open FAA weather camerasFAA weather images. Select Lanai (PHNY) in the Hawaiʻi camera list. Periodically updated airport images, not a beach or surf feed.
Open FAA weather camerasNo verified free beach-stream source is listed here for Molokaʻi or Lānaʻi; the FAA links provide weather-camera coverage instead. Public camera access does not grant access to the camera’s physical location. Provider pages checked September 27, 2026; continuous stream operation is not guaranteed.
Surfline reports, models and cameras open on Surfline. Camera coverage varies by spot; some features may require an account or subscription. No Surfline camera feed or forecast data is reproduced here.
Compare wave height, period and direction at an offshore buoy. Check its observation time and station status before using a reading.
PacIOOS buoy networkNWS / NOAA buoy dashboardCheck the beach’s posted conditions and ask a lifeguard. Rain runoff, currents and closures matter even when the surf looks small.
Hawaiʻi Ocean SafetyHawaiʻi water-quality advisoriesHawaiian (traditional) height is roughly half the wave-face height. We mark that conversion with ≈ and retain the original face range. It is an approximate display convention, not a new measurement or a break-specific model. NWS forecasts and warning thresholds use full face heights. Surfline’s scale explanation · NWS height definitions.
The NWS table estimates the breaking wave’s face. Offshore buoys measure waves at their location; reefs, depth, swell direction and shelter change what reaches a beach. Do not compare those numbers as if they describe the same thing.
Period is the time between waves. Longer-period swell can carry energy farther into shallow water. Swell direction tells you where waves come from; wind can make a spot cleaner or rougher. An offshore wind is not a safety rating.
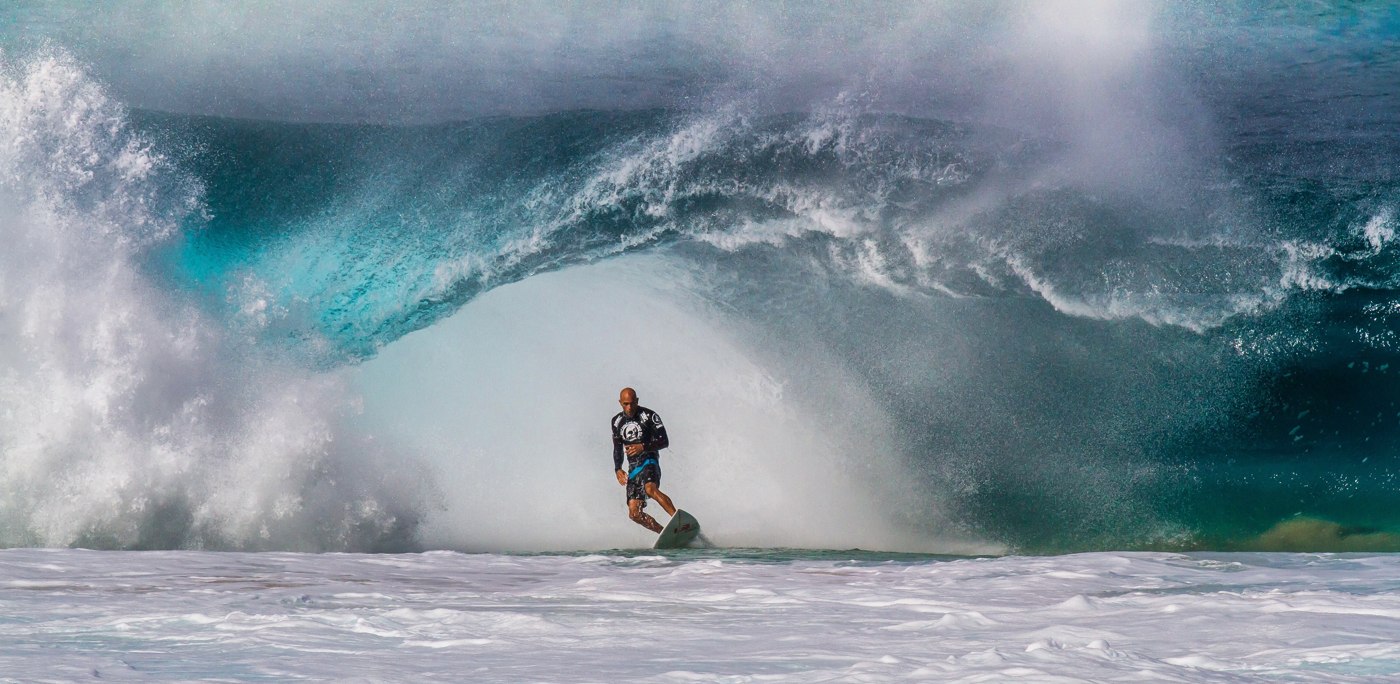
A forecast estimates what will happen. An observation describes conditions at a stated place and time. A camera offers a limited view. The photographs on these pages show the coastline, not today’s conditions.
NWS provides regional forecasts and alerts; Surfline adds spot-focused reports and models; PacIOOS provides wave maps and observations. For entering the water, local hazards, closures and lifeguard advice still decide the plan.
Seasonal shore guide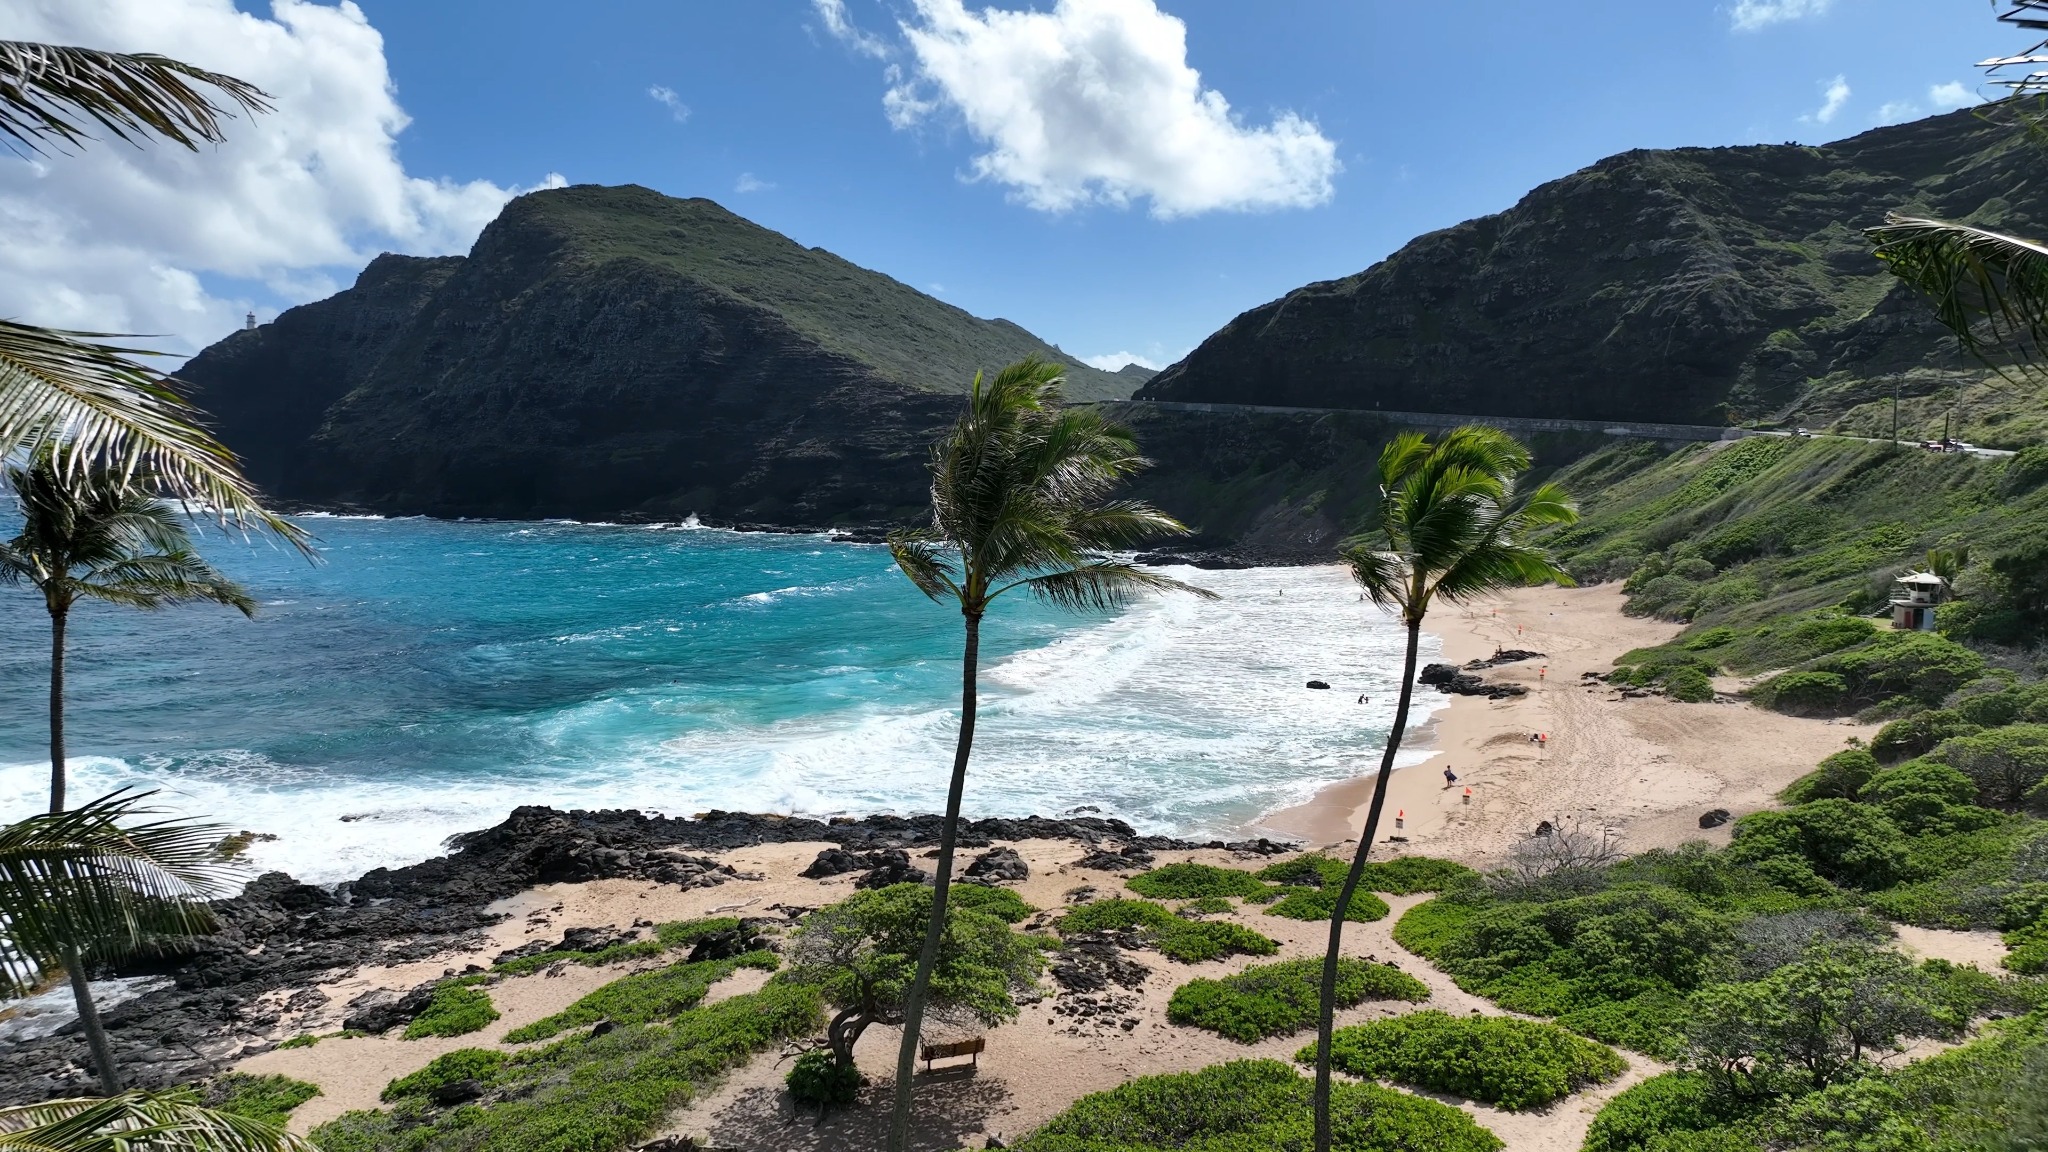
Source directory reviewed September 27, 2026. NWS surf definitions · NOAA wave measurements · PacIOOS wave-model information · Ocean Safety guidance. Spot links help locate a report; they are not recommendations for beginner access or ability.
Loading the National Weather Service surf forecast…
Original NWS wave-face heights are shown first, with approximate Hawaiian-scale estimates underneath. The approximate conversion is half the face height; local calls vary. These are shore-facing forecasts, not individual-break measurements. Bigger sets can exceed the range. All times are Hawaiʻi Standard Time.
Refreshes when opened, every 10 minutes while visible, and on request. The NWS issue time is shown separately from retrieval time. If fresh data is unavailable, use the official links; missing data does not mean small or safe surf.